Nova Scotia Mathematics Activities & Resources
  • Home
  • About
  • Calculus 12
    • CAL12 Limits and Continuity
    • CAL12 Derivatives
    • CAL12 Applications of Derivatives
    • CAL12 The Definite Integral
    • CAL12 Techniques of Integration
  • Pre-calculus 12
    • PCAL12 Function Transformations
    • PCAL12 Radical Functions
    • PCAL12 Polynomial Functions
    • PCAL12 Trigonometry
    • PCAL12 Exponential and Logarithmic Functions
    • PCAL12 Rational Functions
    • PCAL12 Function Operations
    • PCAL12 Permutations and Combinations
  • Mathematics 12
    • MT12 Polynomial Functions
    • MT12 Exponential Functions
    • MT12 Sinusoidal Functions
    • MT12 Financial Mathematics
    • MT12 Set Theory and Probability
    • MT12 Numerical and Logical Puzzles and Games
    • MT12 Research Project
  • Mathematics at Work 12
    • MTW12 Measurement and Probability
    • MTW12 Statistics
    • MTW12 Linear Relations
    • MTW12 Finance
    • MTW12 Geometric Figures and Transformations
    • MTW12 Trigonometry
    • MTW12 Logical Puzzles and Games
  • Mathematics Essentials 12
    • MTHE12 Module 1
  • Pre-calculus 11
    • PCAL11 Sequences and Series
    • PCAL11 Quadratics
    • PCAL11 Systems of Equations
    • PCAL11 Radicals
    • PCAL11 Trigonometry
    • PCAL11 Rationals
    • PCAL11 Absolute Values
  • Mathematics 11
    • MT11 Systems of Linear Inequalities
    • MT11 Quadratics
    • MT11 Logical Reasoning
    • MT11 Angles and Triangle Trigonometry
    • MT11 Statistics
    • MT11 Proportional Reasoning
  • Extended Mathematics 11
    • MTEXT11 Systems of Linear Inequalities
    • MTEXT11 Quadratics
    • MTEXT11 Logical Reasoning
    • MTEXT11 Angles and Triangle Trigonometry
    • MTEXT11 Proportional Reasoning
    • MTEXT11 Sine and Cosine Law
    • MTEXT11 Statistics
    • MTEXT11 Data Analytics
  • Mathematics at Work 11
    • MTW11 Surface Area, Volume and Capacity
    • MTW11 Scale
    • MTW11 Statistics
    • MTW11 Finance
    • MTW11 Slope and Rate of Change
    • MTW11 Right Triangle Trigonometry
    • MTW11 Numerial Puzzles and Games
  • Mathematics Essentials 11
    • MTHE11 Data Management
    • MTHE11 Housing
    • MTHE11 Banking
    • MTHE11 Measurement
    • MTHE11 Taking a Trip
    • MTHE11 Mental Math
  • Mathematics 10
    • MT10 Measurement
    • MT10 Trigonometry
    • MT10 Polynomials
    • MT10 Real Numbers
    • MT10 Relations and Functions
    • MT10 Linear Functions
    • MT10 Systems of Linear Equations
    • MT10 Financial Mathematics
  • Mathematics at Work 10
    • MTW10 Unit Price and Currency Exchange
    • MTW10 Measurement
    • MTW10 Angles and Parallel Lines
    • MTW10 Pythagorean Theorem
    • MTW10 Trigonometry
    • MTW10 Earning an Income
    • MTW10 Spatial Puzzles and Games
  • Mathematics Essentials 10
    • MTHE10 Earning and Purchasing
    • MTHE10 Banking
    • MTHE10 Measurement
    • MTHE10 Geometry
    • MTHE10 Transportation and Travel
    • MTHE10 Probability
    • MTHE10 Mental Math
  • Mathematics 9
    • MT9 Powers and Exponent Laws
    • MT9 Rational Numbers
    • MT9 Square Roots and Surface Area
    • MT9 Linear Relations
    • MT9 Polynomials
    • MT9 Linear Equations and Inequalities
    • MT9 Similarity and Transformations
    • MT9 Circle Geometry
    • MT9 Probability and Statistics
  • Mathematics 8
    • MT8 Square Roots and Pythagorean Theorem
    • MT8 Integers
    • MT8 Operations with Fractions
    • MT8 Measuring Prisms and Cylinders
    • MT8 Percent, Ratio, and Rate
    • MT8 Linear Equations and Graphing
    • MT8 Data and Probability
    • MT8 Geometry
  • Mathematics 7
    • MT7 Integers
    • MT7 Geometry - Transformations
    • MT7 Fractions, Decimals, and Percent
    • MT7 Linear Patterns and Relations
    • MT7 Circles and Area
    • MT7 Operations with Fractions
    • MT7 Equations
    • MT7 Data Analysis
    • MT7 Geometry - Constructions
  • Contact

Mathematics 8 Data and Probability

Specific Curriculum Outcomes

SP01      Students will be expected to critique ways in which data is presented.

SP02      Students will be expected to solve problems involving the probability of independent events.

SP01 activities

  • How to Spot a Misleading Graph a TED-Ed video from Lea Gaslowitz - When they’re used well, graphs can help us intuitively grasp complex data. But as visual software has enabled more usage of graphs throughout all media, it has also made them easier to use in a careless or dishonest way — and as it turns out, there are plenty of ways graphs can mislead and outright manipulate. Lea Gaslowitz shares some things to look out for in this short 4 minute TED-Ed video.
  • How to Spot Visualization Lies from Flowing Data - It’s important to quickly decide if a graph is telling the truth. This a guide to help you spot the visualization lies.
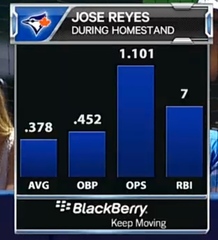
  • Sport's Nets Bar Graphs - An example of a bar graph that shouldn't be one. It attempts to use a bar graph to compare four statistics THAT HAVE COMPLETELY DIFFERENT UNITS! And then, even more insanely, among the three rate statistics, they included Runs Batted In (RBI), which is a counting statistic. And for an unknown reason, SOMEONE DECIDED THAT 7 IS SOMEWHERE IN BETWEEN 0.452 AND 1.101!
Picture
  • Shut up about the y-axis. It shouldn’t always start at Zero from Vox.com - Watch this video from vox.com about graphing axes.  The truth is that you certainly can use truncated axes to deceive. But you can also use them to illuminate. In fact, you often have to mess with the y-axis in order to craft a useful image — especially because data sometimes reaches into negative territory and sometimes goes nowhere near zero. The right principle is that charts ought to show appropriate context. 
  • Playing Around with Data Routines Part 1 from Kassia Wedekind - Kassia describes a routine where she slowly reveals the numbers, legends and titles of a graph and asks students what they notice and wonder about the graph as she goes.  It slows the thinking down and focuses on sense-making rather than answer-getting.

SP02 Activities

  • Even or Odd? from Mark Chubb - A dice game for 2 players. Player one rolls 2 dice & multiplies them.  Player two rolls 3 dice & adds them.  Each player scores 1 point every time they get even number. Which player do you want to be: Player 1 or Player 2?  Once you've made a prediction, play the game for a number of rounds (e.g. 20 or so) to see who wins.  Look at the class data to see if there is a pattern.
Powered by Create your own unique website with customizable templates.